This article presents a new method for detecting meteor reflections in radio signals for the BRAMS network. As illustrated in Figure 1, these reflections are typically viewed as spectrograms (What is a Spectrogram?). Hence, a straightforward way to approach the detection problem is to work directly with the spectrogram. However, I’ve been trying to convince people to try to use the original time signal directly, because that might be simpler, quicker, and more directly tied to the physical event (i.e., the radio signal reflected on the plasma trail left by the meteor). Recently, I’ve been “walking the walk” and have developed a method that does just that (for underdense meteors). I have presented this idea at the International Meteor Conference (IMC) in Giron, France. Have a look at my article in the proceedings of the IMC [pdf] for more details than in this post.
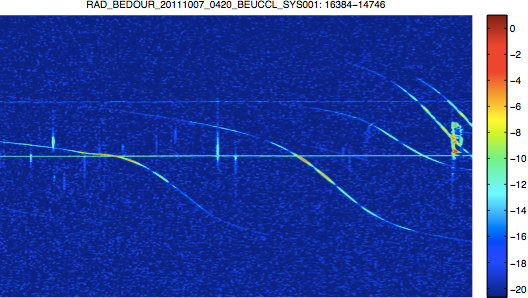 Figure 1. Typical BRAMS spectrogram.
I have to stress that there is, of course, nothing wrong with using the frequency information in the signal. I actually do just that in my preliminary band-pass filter, as I describe below. Since the strength of the received signal is essentially given by the received power, I’ll use the power as the basic signal, shown in Figure 2 for the signal corresponding to the given spectrogram.
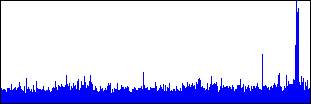 Figure 2. Signal power.
Preliminary Bandpass Filter
Looking at the spectrogram again, The first thing to note is that most of the received power is concentrated in a rather narrow band around the carrier. Especially since the shown spectrogram is only 200 Hz out of a total bandwidth of 2756 Hz (half of the sampling rate of 5512 Hz). Since noise is typically wideband, a lot of it can be suppressed by applying a band-pass filter, while retaining all the interesting information. Figure 3 shows the signal power after such a filter was applied to the original signal.
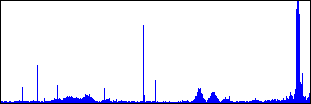 Figure 3. Filtered signal power.
In the filtered signal, the noise has diminished and the peaks from the meteors are more evident. However, the “bumps” that are caused by the planes are about the same size as the smaller meteors, making it difficult to set a threshold for detection.
The Indicator Signal
To try to alleviate this, I propose to compute an indicator signal, as defined below. The design of the indicator signal is based on the observation that meteors are very short, while plane reflections are long. For each sample, the indicator signal is the ratio of the energy in a short interval and the energy in a long interval. In practice, the energy in an interval can be computed from the average power in that interval. For a signal \(x[n]\), if the running average of the power in an interval of length \(S\) (assumed to be odd) is given by
\[p_S[n]=\left(\sum_{i=n-\lfloor S/2\rfloor}^{n+\lfloor S/2\rfloor}(x[i])^2\right)\,/\,S,\]
then the energy in the surrounding interval, for each sample, is given by \(E_S[n]=Sp_S[n]\). The indicator signal is then defined as
\[I[n]\equiv\frac{E_S[n]}{E_L[n]},\]
with \(E_L[n]\) defined analogously to \(E_S[n]\). The indicator signal is illustrated in Figure 4, again for the data that was used for the shown spectrogram.
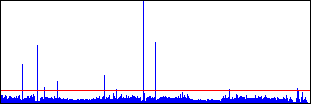 Figure 4. Indicator signal.
The general idea is that the short interval should be chosen to be about the length of a typical underdense meteor. The long interval then compensates for the disturbance of the signal that is caused by the planes.
Meteor Detection
The meteors can then be detected with a simple threshold, which is also indicated on the plot above. Below, the spectrogram is repeated with each detected meteor indicated with a red dot.
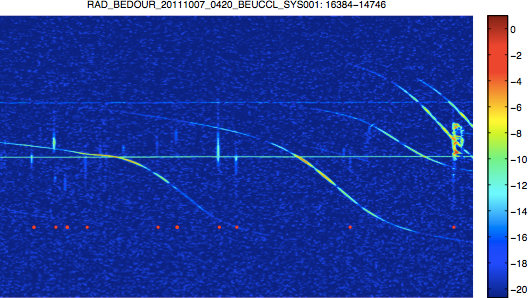 Figure 5. Spectrogram with detected meteors.
Python Code
This article comes with a Python implementation of the indicator signal. This script has reasonable values for the parameters. If you are interested in the data that I’ve used both in this article and in the proceedings of the IMC, let me know and I’ll email it to you.
Note that this indicator signal is not meant to be the definitive algorithm. It is an initial attempt, but it does show that it is feasible to use the time signal for detection. If you work with these kinds of observations, I would like to warmly invite you to look at these kinds of detection algorithms.
Add new comment