This is the second of four articles on tomography (also read the first one, the third one, and the fourth one).
This article shows that it is possible to reconstruct the inside of a person or object from (lots of) projections of that person or object. Mathematically, tomography is based on the fact that the function values of a two-dimension functional \(f(x,y)\) can be calculated from projections of that function. This basic fact was discovered by Johann Radon, an Austrian mathematician, who published it in 1917. The mathematical operation that transforms a two-dimensional function into projections is therefore called the Radon transform. Radon also showed the inverse of this operation in his paper, so that we can more or less state that tomography was, mathematically, solved in 1917.
In the real world, of course, things are a bit different. The Radon transform is defined between one continuous space and another, but in an actual scanner you don’t take an infinite number of projection images, and you do create your reconstruction on a finite grid of pixels. Add to this physical imperfections in the scanner (stability of the source, sensitivity of the detector, mechanical imperfections, etc.) and measurement noise, and it is not so simple anymore.
Returning to the “ball in a box” from the first article in this series, let’s look at what we need for reconstructing the inside of an object. Below is a series of seven (simulated) X-ray images, as seen from different angles, with 15 degrees increments (0, 15, 30, 45, 60, 75, and 90 degrees). You can picture this as either rotating the object, or moving the scanner around it. Since the object is symmetrical, the projection at 90 degrees is identical to the one at zero degrees. For an object in general, projections over 180 degrees are necessary. Try to understand these images. Where did the side of the box go in the rotated projections? What happens with the hole in the ball?
 Projections of box with ball, 15 degrees angle increments
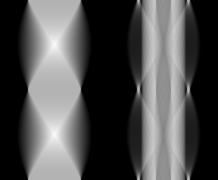
These seven projections are not at all sufficient for tomography! Below, 180 projections with one degree increments are shown for two single slices of these images, in so-called sinograms. Picture these slices as horizontal cuts through the 3D object. Each horizontal line of the sinogram is then the (1D) projection of the (2D) slice in one direction. The left sinogram is a cut throught the top of the cube, so it is, in effect, the sinogram of a (filled) square. The right sinogram is a cut through the middle of the object, at the place where the ball has its maximal size.
 Sinograms of box with ball
From 180 projections, it is possible to create a reconstruction. Keeping actual reconstruction algorithms that are used in practice for the next article, I show below that it is effectively possible to create a (very blurry) reconstruction by simply backprojecting the sinogram. In backprojection, each projection (horizontal line in the sinogram) is simply smeared out over the image in the direction of the original angle. When all these backprojections are summed, the result is the image below. The two leftmost images are the original object (corresponding to the left and right sinogram, respectively), the two rightmost are the reconstruction.
 Reconstructions of box with ball
These are not usable reconstructions in practice, because something essential is still wrong. The next article explains what this is.
Add new comment