This is part two of an article that describes the signal path of a radio meteor (also read part one and part three).
Combination with the Directly Received Signal at the Antenna
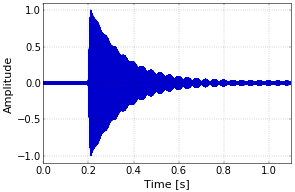
Part one of this article ended with a figure showing the amplitude-modulated carrier. This is the carrier as it looks after the reflection off the trail. At the antenna of the receiver, the reflected signal is combined with a (much smaller) directly received signal. At first sight this might seem unimportant, since the amplitude of the direct component is typically much less than the amplitude of the signal of interest. However, due to the Doppler shift of the reflected signal, the two signals have a different frequency. And that is where the trouble starts, since adding two signals with a slightly different frequency produces beats (Figure 1). In this example, the level of the direct signal is 2% of the level of the reflected signal, and the Doppler offset of the reflected signal is 25 Hz.
 Figure 1. Combined reflected and directly received signal.
If we write the amplitude of the directly received signal as \(D\), the Doppler offset as \(f_D\), and reiterate from part one the notation of \(f_T\) for the transmitter frequency and \(A(t)\) for the amplitude modulation caused by the reflection off the trail, then the combined signal \(s_C(t)\) can be written as
\[s_C(t)=D\sin(2\pi f_Tt)+A(t)\sin(2\pi(f_T+f_D)t).\]
Effect of the Receiver
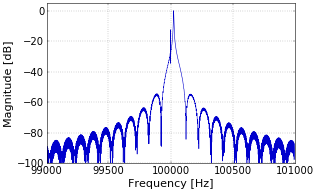
The signal of Figure 1 is the input of the receiver. Since the effect of the receiver is to frequency down convert the signal to a center frequency of about 1 kHz, we have to look at the signal in frequency space (Figure 2). For the simulation that produces these figures, I’ve used a transmitter frequency of 100 kHz instead of 49970000 Hz to reduce the running time of the simulation. This is completely equivalent, since the down conversion step is independent of the frequency. Figure 2 only shows a small region around 100 kHz. The small peak in the middle of the figure is the directly received signal. The reflected signal peaks at a 25 Hz higher frequency (this is the Doppler offset), and also causes the side lobes.
 Figure 2. Detail of spectrum of received signal.
At the receiver, the signal is mixed, i.e., multiplied, with a local oscillator (LO) at a small frequency offset of 1 kHz. This is done simply by tuning the receiver to a frequency of 49969000 Hz instead of the exact value of \(f_T\), which is 49970000 Hz.
Note that this multiplication of signals is completely different from what happens at the antenna, where two signals are added. Moreover, the offset of the LO is on purpose. The effect of mixing the received signal with an LO that is offset is that the frequency contents of the meteor reflection is down converted, i.e., its frequencies are shifted from its original frequencies around \(f_T+f_D\) to a range of frequencies around 1 kHz.
When sinusoids at two frequencies \(f_1\) and \(f_2\) are multiplied, we have that
\[\sin(f_1)\sin(f_2)=\cos(f_1-f_2)-\cos(f_1+f_2),\]
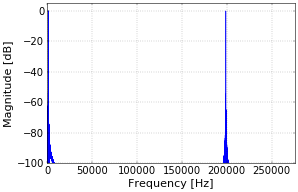
from the well-know product-to-sum trigonometric identities. This means that, for an ideal mixer, the result of mixing is a first frequency component at the difference \(f_1-f_2\) and a second frequency component at the sum \(f_1+f_2\) of the original frequencies. The result of the mixing operation is shown in Figure 3, again for a transmitter frequency of 100 kHz. For this frequency, the two components are at 1 kHz and 199 kHz.
 Figure 3. Spectrum of received signal mixed with local oscillator.
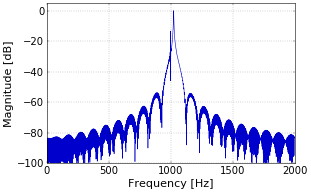
To illustrate that the two components are indeed copies of the original spectrum, Figure 4 shows a detail of the spectrum from Figure 3, centered at 1 kHz.
 Figure 4. Detail of spectrum of mixed signal.
The next step is sampling, followed by the generation of spectrograms instead of spectra. This is covered in part three of this article.
Add new comment