I am not a visualization specialist, but I’m convinced that the often used rainbow color map is not well suited for scientific visualization. It might be attractive, but it is not effective. I’m quite sure that many of you won’t agree on the attractive part, but, given the popularity of the rainbow map, many people do seem to like it…
 Figure 1. The diverging color map is the new rainbow color map.
This post mainly introduces diverging color maps as a much better alternative. My main source for the material on diverging color maps themselves is the article Diverging Color Maps for Scientific Visualization by Kenneth Moreland. However, the “badness” of the rainbow color map is described in many other places, such as How The Rainbow Color Map Misleads.
The Rainbow Color Map Is Bad
One of the main applications of scientific visualization of data is to map numbers to colors. Using the rainbow color map for that can cause several problems. Three important ones are the following.
- Research indicates that people do not automatically put the colors of the rainbow map in the right order. This can lead to a completely wrong interpretation of the data.
- The perceptual rate of change of the colors is not the same throughout the entire color range. For example, the green region is much broader than the yellow one. This can lead to confusion if data values with comparable rates of change are mapped to those regions.
- People with the relatively common red–green color blindness (about 5% of the population) perceive some of the colors that are not even adjacent in the map as very close together.
Diverging Color Maps
Diverging color maps are designed to avoid the problems of the rainbow map as much as possible. Take for example the “cool-to-warm” map that is shown at the top of Figure 1. A natural usage of this map is the display of some property that has a neutral value and some regions with both “lower” and “higher” values. Temperature would be a perfect, and obvious, example. The map has constant rate of change, which makes it much easier to map the colors back to numbers in your head. Additionally, it is interpreted correctly by people with red–green color blindness.
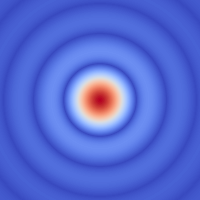
For my own stuff, I’ve mostly used grayscale maps (see for example my articles on image processing). As an example of how the Airy pattern from The Perfect Camera would look, I’ve added the “cool-to-warm” color map to it (Figure 2).
 Figure 2. Airy pattern with cool-to-warm color map.
This image might not be a particularly good example, because it doesn’t have a neutral value that is somewhere in the middle. However, even then it reveals more detail in the originally very dark part of the image away from the center.
Python Code
Since I’m trying to combine promoting an interest in science with being useful, I’ve included a Python script below that creates the “cool-to-warm” map and then applies it to the Airy pattern. In practice, you’d create the .csv file only once, of course, but I wanted to keep everything together. The diverging_map module can be downloaded from the site of Kenneth Moreland.
# Python 2 only, since the diverging_map module is not compatible with Python 3.

import numpy as np
from imageio import imread, imwrite

import diverging_map as dm

# Create cool-to-warm color map and save to file.
RGB1 = np.array([59, 76, 192])
RGB2 = np.array([180, 4, 38])
dm.ColorMapCreator(RGB1, RGB2, numColors=257, filename='cool-to-warm.csv')

# Load cool-to-warm colormap from file.
rgb = np.genfromtxt('cool-to-warm.csv', delimiter=',')

# Load example, apply color map, and save example again.
im = imread('airy-pattern.png').astype(np.float) / 255
im_rgb = np.zeros((im.shape[0], im.shape[1], 3))
for i in np.arange(0, im.shape[0]):
    for j in np.arange(0, im.shape[1]):
        im_rgb[i, j, :] = rgb[int(np.round(im[i, j] * 256)), :]
imwrite('airy-pattern-cool-to-warm.png', np.uint8(im_rgb * 255))
Add new comment