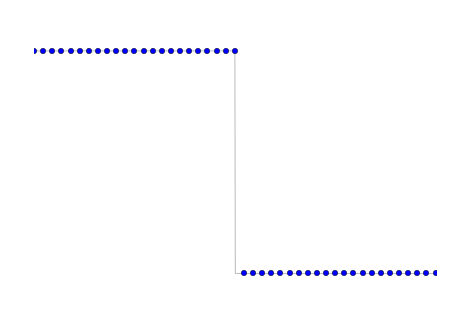
After introducing the Finite-Bandwidth Square Wave and then showing how the actual samples should look on a digital system in Finite-Bandwidth Square Wave in Samples, I’ll now describe what happens if you follow the naive approach and do something like in the image below.
 Naive square wave
This seems simple, right? You just alternate sequences of 1’s and −1’s and there is your square wave. Concretely, the image above is one period of a 1 kHz wave, at a sampling rate of 44.1 kHz.
Problems
Now, as you might expect, there are several problems with this. The first problem is that this naive square wave is not correctly bandwidth-limited. Of course, when reproduced through a sound system, it will be bandwidth-limited, only not in the correct way.
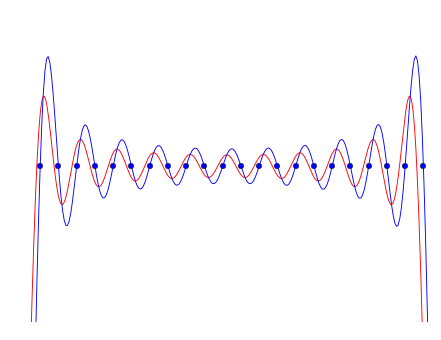
The blue curve in the figure below shows the top part of one period of the resulting analog waveform. Note that it “hits” each of the samples (the blue dots), as it did in the second figure of the previous article. The red curve shows a correctly bandwidth-limited analog square wave that contains harmonics 1 through 21. So which one do you choose, the red curve or the blue curve? It is clear from this example that the oscillations are worse for the naive square wave than for the correct one. So the naive approach is not optimal, and you should always take the red pillcurve.
 Interpolated naive square wave
There is, however, a second problem that is actually worse. Because each series of 1’s and −1’s has to have an integer length, they can’t all be the same length. For this concrete example, which is a 1 kHz wave sampled at 44.1 kHz, we need 44.1 samples in each period (44100/1000=44.1). This means that, however you do it, you will have to alternate between 44 and 45 samples. And this has a noticeable effect on the quality of the sound.
In Practice: Audio Samples
The following audio fragment contains a two second sample of a 1000 Hz wave. The first part of the sample is a correctly bandwidth-limited square wave. Then there is a small pause, followed by a naive square wave, as described above. It might be subtle, but you can clearly hear that something is different in this second part of the sample. There is a nasty sound that isn't there in the first part, caused by the lengths of the periods alternating between 44 and 45 samples.
Correct and Naive Square Waves at 1000 Hz
If the frequency of the wave is changed to allow for a constant length of all the series of 1’s and −1’s, the nasty sound disappears. The audio sample below shows this with a frequency of 882 Hz, where each period takes exactly 50 samples (44100/882=50). There is no audible difference between the first and the second part of the sample anymore. The larger fluctuation of the signal, which is still there, is inaudible in the example, so it seems much less important.
Correct and Naive Square Waves at 882 Hz
Add new comment