This article is a wrap-up of what happened on TomRoelandts.com in 2016.
The main trend from last year continued: the articles on Filter Design were by far the most popular. The article How to Create a Simple Low-Pass Filter alone was responsible for 19.7% of all pageviews. I’ve listened to my readers and have added several new ones, including, in the last week of the year, How to Create a Configurable Filter Using a Kaiser Window.
Other popular articles were Earth-Moon System to Scale and The SIRT Algorithm. As last year, the fact that these articles appear in the “Popular Articles” list in the sidebar has little effect, since most visitors arrive via search engines (of which a large percentage is Google).
Analytics, Baby!
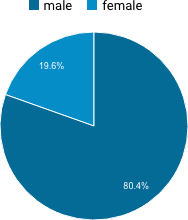
Since Google Analytics provides (anonymized) demographical data, I thought it might be interesting to talk a bit about that. Regarding gender, it turns out that, in 2016, 80.4% of my readers were male, and 19.6% were female (Figure 1). The ratio between both might be higher than you would expect. However, from my personal experience of working with many different people in about two decades of software development and signal and image processing, I would say that it reflects reality quite well. Tips to better cater to the female half of the population are welcome!
 Figure 1. Gender of readers of TomRoelandts.com in 2016.
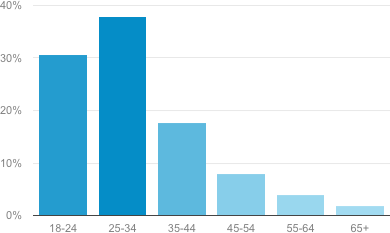
The other main data point of interest is the age distribution of my readers (Figure 2). The bulk of the graph is taken up by the 18–24 and 25–34 ranges. Google does not provide information on readers younger than 18 years, but I don’t think that most of my posts are very interesting for that category anyway. The age distribution of Figure 2 seems to suggest that many of my readers are students and young professionals, and I’m quite happy with that.
 Figure 2. Age distribution of readers of TomRoelandts.com in 2016.
Data like this has to be taken with a grain of salt, of course, since Google can never be 100% sure on things such as age or gender. Anyway, I hope you find it interesting to know a bit more about your fellow readers…
Add new comment