This is part one of a rather basic article that describes the complete signal path of a radio meteor, from the sinusoidal carrier wave that is initially transmitted, to the spectrogram that is typically used as the final result in the receiving chain. I have presented this material at the International Meteor Conference (IMC) in Egmond, the Netherlands. If you want, you can have a look at my article in the proceedings of the IMC [pdf].
This article is written from the point of view of the BRAMS network. I have written an article on meteor detection for BRAMS before, so go there for more information.
Overview
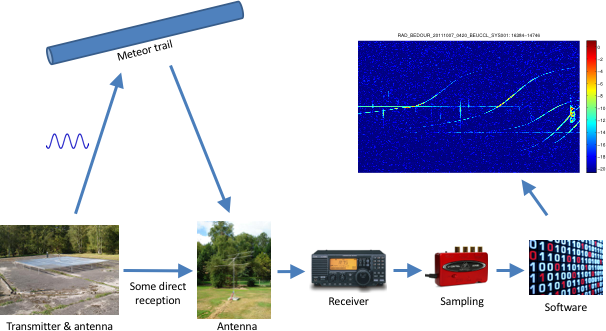
Figure 1 show an overview of the signal path. The antenna of the transmitter sends out a so-called unmodulated carrier, i.e., a simple sinusoid, in all directions. If a meteor trail with a geometrically favorable orientation is present, it reflects the carrier wave towards the antenna of the receiver. This antenna picks up the signal, together with a directly received component. The receiver then frequency down converts the signal, i.e., it lowers its frequency, so that the sampling step that follows can use a much lower sampling rate. After some further processing, the software then finally generates a spectrogram.
 Figure 1. Overview of the radio meteor signal path.
The transmitted radio signal \(s_T(t)\) is a plain sinusoid. For a transmitter frequency of \(f_T\), it can simply be written as
\[s_T(t)=\sin(2\pi f_Tt).\]
Specifically for BRAMS, \(f_T=49970000\,\mathrm{Hz}\). From a theoretical point of view, this signal is affected in a meaningful way at three points.
- It interacts with the meteor trail, which is the effect of interest.
- It is combined with the directly received signal at the antenna.
- It is frequency down converted by the receiver.
From a practical point of view, there is also noise and all sorts of, hopefully minor, influences due to atmospheric effects and imperfections of the electronics. I’ll ignore this to keep things simple. The model of the meteor reflection that I’ve used is also unrealistically simple, but it serves well to show the overall mechanism.
Interaction with the Meteor Trail
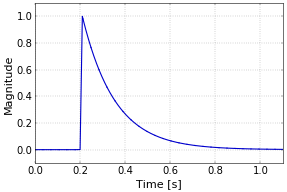
The effect of this interaction is a modulation of the amplitude of the carrier. I’ve use the classical model for an underdense meteor for simplicity. This is illustrated in Figure 2. If a meteor appears, a plasma trail is formed very quickly. This corresponds with the fast linear rise at the beginning of the meteor (0.2 s into the plot). The signal rises quickly, but not instantaneously, i.e., it doesn’t suddenly jump from zero to one. After the trail is formed, it immediately starts to dissipate again. This causes the density of the trail do decrease exponentially. This dissipation is quite fast, but slower than the formation of the trail. After about one second, the signal amplitude is almost back to zero again, for this particular example.
 Figure 2. Radio meteor amplitude profile.
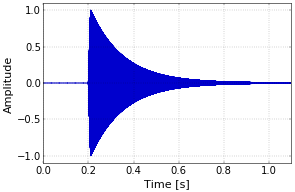
The effect on the carrier is straighforward, as shown in Figure 3. Before the meteor appears, the reflected signal is zero. During the time that the trail is present, the amplitude profile of the meteor is directly visible in the amplitude of the carrier. The graph is solid blue because of the very high frequency of the carrier in comparison with the amplitude change caused by the meteor.
 Figure 3. Amplitude-modulated carrier after reflection off the meteor trail.
A second effect of the reflection off the trail is that the frequency of the carrier may be shifted due to the Doppler effect, if the trail is moving due to high altitude winds. Such a Doppler shift is observed very often in practice. If the amplitude modulation is written as \(A(t)\) and the Doppler shift is \(f_D\), then the resulting waveform \(s_R(t)\) can be written as
\[s_R(t)=A(t)\sin(2\pi(f_T+f_D)t).\]
The frequency shift is not visible in the plot of Figure 3, but it has an important effect when the reflected signal is later combined with the directly received one. This is covered in part two of this article.
Add new comment