This is part three of an article that describes the signal path of a radio meteor (also read part one and part two). Part two of this article ended with a figure showing the spectrum of the received signal, after mixing with the local oscillator (LO) of the receiver. The next step after that is sampling.
Sampling
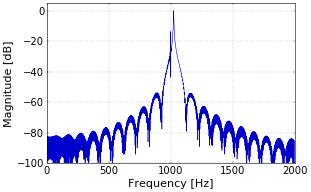
At the point of sampling, there is a difference between a real-world BRAMS system and the simulation that produced the illustrations in this series of articles. In the real system, the signal is an analog electrical signal up to this point, and the sampling operation then changes it into a digital signal. The simulation, on the other hand, is digital from the very beginning. However, all the described operations are fundamentally the same in the analog and digital domains, especially since imperfections of the electronics are ignored anyway. In the simulation, the “sampling” operation is only a down sampling, which reduces the sampling rate of the signal. Figure 1 shows the spectrum of the sampled signal, centered at 1 kHz. It is very close to the figure at the end of part two.
 Figure 1. Detail of spectrum of sampled signal.
Comparison with the Original Spectrum
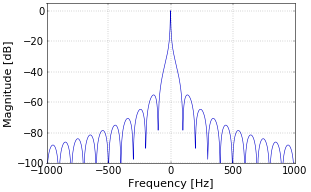
To further demonstrate that the operations up till now, including the frequency down conversion that the receiver performs, are quite transparent, the spectrum of the original meteor profile is shown in Figure 2.
 Figure 2. Spectrum of meteor profile.
There are, of course, a number of differences. First, the meteor profile in Figure 1 is shifted 25 Hz to the right, because of the Doppler shift of the simulated reflection. Second, there is a little extra peak just to the left of the main one, because of the directly received signal. Apart from that, it seems clear that the sampled signal can be used to study the properties of the meteor profile.
Spectrogram
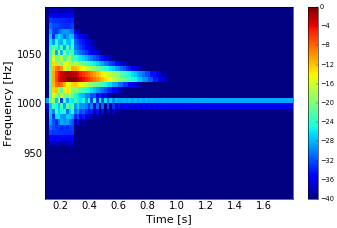
Although spectra are a very insightful way to compare the signal at the different stages of processing, they do not provide insight into the time component of the received signal. For that, a spectrogram is generated (Figure 3). In the spectrogram, we again discern the directly received signal, and we can observe the beats in the carrier. The Doppler shift of 25 Hz is also obvious.
 Figure 3. Spectrogram of sampled signal.
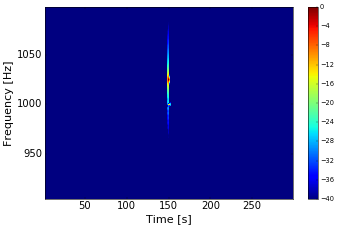
For comparison with the spectrograms as they are usually presented for BRAMS (see for example the article Meteor Detection for BRAMS Using Only the Time Signal), Figure 4 shows the same spectrogram as Figure 3, but then for the usual time period of five minutes.
 Figure 4. Scaled spectrogram of sampled signal.
And that was it, the complete path of a radio meteor from transmitter to spectrogram…
Add new comment