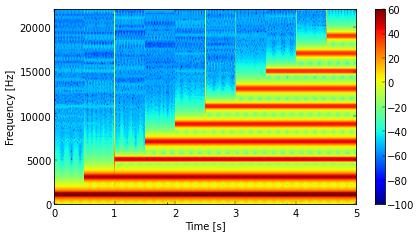
A spectrogram is a graph that shows the evolution of the spectrum (the frequency contents) of a signal over time. Often, the frequency is on the vertical axis and time is on the horizontal axis. A spectrogram is computed by “chopping up” the signal into chunks and computing a spectrum for each of those. These different spectra are then put next to each other (as vertical lines) to form a 2D image. The figure below is an example.
 Spectrogram of square wave with harmonics 1, 3, 5, …, 19
Not That Square Wave Again…
The spectrogram above uses the audio fragment, repeated below, of the finite-bandwidth square wave from a previous article. The frequency range is from 0 to 22050 Hz because the sampling rate was the standard 44.1 kHz.
Square Wave with harmonics 1, 3, 5, …, 19
The spectrogram demonstrates that the frequency structure of this audio fragment is quite simple, with sines being “piled up” one after the other.
.ogg and .mp3
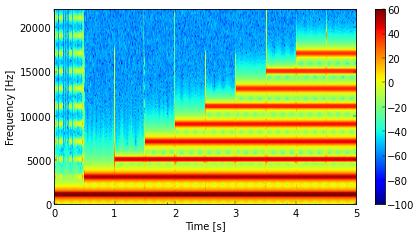
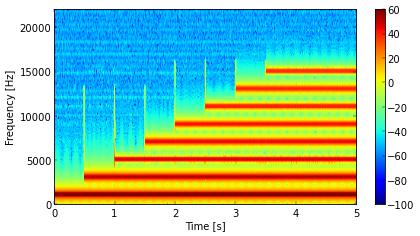
Lets use the spectrogram to look at the effect of the lossy compression that is typically applied in digital audio to keep the file size reasonable. For these kinds of audio fragments to work on a website, the webserver needs to provide a .ogg and a .mp3 version of the original .wav file. Depending on your browser, only one of these will then be downloaded and played when you click the play button. In the mentioned article, I state that both “sound very much the same” as the .wav file. However, by comparing the spectrograms we can immediately spot a key difference between the three versions of the file. The spectrograms for the .ogg and the .mp3 versions are shown below.
 Spectrogram of square wave, from .ogg file
 Spectrogram of square wave, from .mp3 file
It is clear that the low-pass filter of the MP3 encoder has a lower cutoff frequency than that of the Ogg Vorbis encoder. In the .ogg file, harmonic 19 is missing, and in the .mp3 file, both 17 and 19 are missing. But this simple experiment does not indicate a fundamental difference in quality between both encoders, since these kinds of parameters can be tuned. I simply used both encoders with default settings, through the following commands.
oggenc square-wave-varying.wav -o square-wave-varying.ogg
lame square-wave-varying.wav square-wave-varying.mp3
In the end, the spectrograms show that, except for the highest frequencies, the three versions of the audio file are quite similar.
Nice article Tom but it leaves me some questions if a look very carefully at pictures
Why does the overshoot appear at the start of each harmonic in the original spectrum
And why do they look to be amplified in the MP3 pictures ?
Is there some kind of explanation for this ?
I suspect that the broadband spikes are caused by the abrupt addition of the sine. This is a sudden change, like an impulse or a step function, so it must have a broad frequency range. To avoid this, I would have to introduce the new sine gently, but I didn't do that here. I don't know why the lossy algorithms amplify this effect, but, since they are quite complicated, this doesn't really surprise me.
Add new comment