An analytic signal is a signal without negative frequency components. This might seem a strange concept if you’re not used to it, but analytic signals are used in signal processing, for example in modems for telecommunications.
Let’s start from a basic example. Say that you have a simple sinusoidal wave, given by
\[\cos(2\pi ft),\]
where \(t\) represents time and where \(f\) is the frequency in Hertz. The value of \(\cos(2\pi ft)\) is exactly the same for positive and negative frequencies \(f\). Compare this to the frequency with which a wheel rotates: if I tell you that the frequency is 10 Hz, then you know that it rotates 10 times per second, but you don’t know in which direction. Hence, the frequency could be either positive or negative. The analytic representation of a signal does not have this restriction.
Definition
The analytic representation \(\tilde{s}(t)\) of a signal \(s(t)\) is defined as the sum of itself and \(i\) times its Hilbert transform. In turn, the Hilbert transform of a signal is defined as the signal in which all frequency compontens of the original signal have their phase shifted by 90°. In other words, the analytic representation of a signal can be written as
\[\tilde{s}(t)=s(t)+i\mathcal{H}(s(t)),\]
where \(\mathcal{H}(s(t))\) is the Hilbert transform of \(s(t)\).
For the example cosine function,
\[\mathcal{H}(\cos(2\pi ft))=\cos\left(2\pi ft-\frac{\pi}{2}\right)=\sin(2\pi ft).\]
This means that the analytic represention of the example signal is
\[\tilde{s}(t)=\cos(2\pi ft)+i\sin(2\pi ft)=e^{i2\pi ft},\]
where the last equality is Euler’s formula, \(e^{ix}=\cos(x)+i\sin(x)\). It is this complex exponential form \(e^{i2\pi ft}\) that is used a lot in signal processing.
Note that you can go back from \(\tilde{s}(t)\) to \(s(t)\) by simply taking the real part of \(\tilde{s}(t)\), because
\[s(t)=\Re(\tilde{s}(t))=\Re(e^{i2\pi ft})=\cos(2\pi ft).\]
This is also true because of Euler’s formula. It is also true in general for all analytic signals, and not only for this particular example.
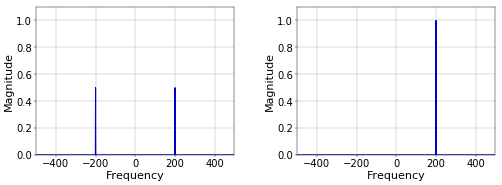
Figure 1 shows the Fourier transform of both \(\cos(2\pi ft)\) and \(e^{i2\pi ft}\), for \(f\) equal to 200 Hz. It is clear that the negative frequency component of the cosine is removed in the analytical representation. For more complicated signals, the spectrum for negative frequencies is the mirror image of the spectrum for positive frequencies, and only the positive half remains in the analytical representation.
 Figure 1. Spectra of cosine (left) and complex exponential (right).
Advantages
One of the crucial points to take home is that the original cosine function generates (only) an amplitude for each point in time, while the analytical representation generates a rotating vector in the complex plane (or a combination of many of those for more complicated signals). For the particular example of \(e^{i2\pi ft}\), the vector has length one, and its coordinates in the plane are \((\cos(2\pi ft),\sin(2\pi ft))\) for each point in time \(t\). This follows, again, directly from Euler’s formula. For positive frequencies \(f\), the vector rotates counterclockwise. For negative frequencies, it rotates clockwise.
A major consequence of this is that the analytical representation provides instantaneous values for parameters such as amplitude, power, and phase, using only a single sample of a discrete signal. For the original sinusoid of our example signal \(\cos(2\pi ft)\), this is not true. The amplitude of the cosine varies all the time. To compute the power, for example, you need to integrate over a number of samples. For the case of the complex exponential, each individual sample can be used to compute the power. In the case of \(e^{i2\pi ft}\), this power is one for all \(t\).
As an example of an application in modems, look at Figure 3 in the article How Does Amplitude Modulation Work?. If you start from the blue signal from Figure 3 and take the absolute value of its analytic representation, you get exactly the red signal. Hence, you have demodulated the signal.
Add new comment