To finish the series of articles on how to compute fractals using NumPy array operations, I want to show you one more thing: how to create animated GIFs from those NumPy arrays.
An important point to make is that you can always simply save your images as PNG files, and then use any software that you like to create an animated GIF. Examples of how to save images as PNG are shown in How to compute the Mandelbrot Set using NumPy Array Operations, which directly saves a NumPy array using scipy.misc.imsave(), and How to Compute Colorful Fractals using NumPy and Matplotlib, which creates a Matplotlib figure first and then saves it using matplotlib.pyplot.savefig(). You can then use Photoshop, GIMP, etc.
However, it is a lot more convenient if you can create the animated GIFs directly from your Python script, so that you don’t have to work with temporary files. To do that, I went the way of matplotlib.animation. Since the details can be hairy, I’ll just go over the main functions and leave you with a complete Python program to experiment with. You can then check the official documentation for the details.
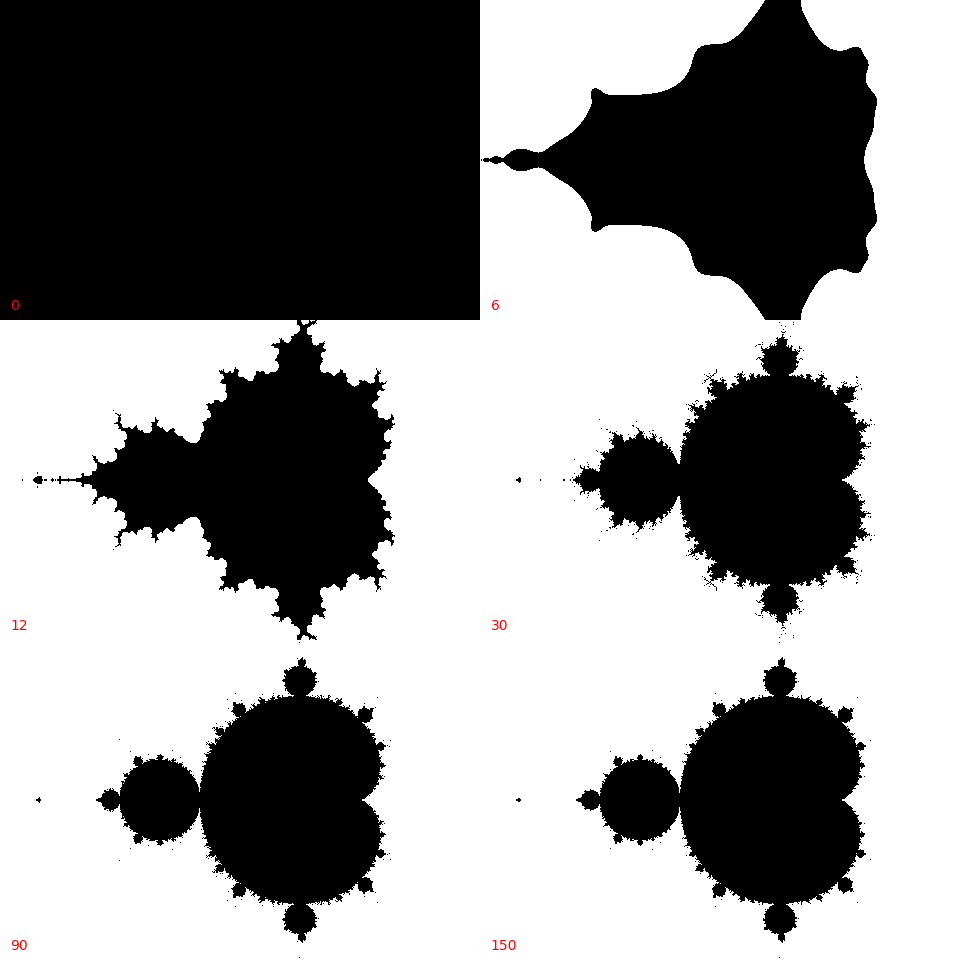
As an example, I’ve taken the Mandelbrot fractal from How to compute the Mandelbrot Set using NumPy Array Operations. The animated GIF of Figure 1 shows the first fifteen iterations and then every ten iterations from 20 to 150.
 Figure 1. Animated Mandelbrot set showing when points escape.
I’ve worked with a class this time. The __init__() method creates a Matplotlib figure and applies a number of settings to get rid of the axes and stuff; it also creates an empty list of images:
from __future__ import division

class AnimatedGif:
    def __init__(self, size=(640, 480)):
        self.fig = plt.figure()
        self.fig.set_size_inches(size[0] / 100, size[1] / 100)
        ax = self.fig.add_axes([0, 0, 1, 1], frameon=False, aspect=1)
        ax.set_xticks([])
        ax.set_yticks([])
        self.images = []
The add() method then uses Matplotlibs imshow() to generate the image, and appends it to the list of images:
    def add(self, image, label=''):
        plt_im = plt.imshow(image, cmap='Greys', vmin=0, vmax=1, animated=True)
        plt_txt = plt.text(10, 310, label, color='red')
        self.images.append([plt_im, plt_txt])
The save() member creates the actual animation using the ArtistAnimation class from matplotlib.animation:
    def save(self, filename):
        animation = anim.ArtistAnimation(self.fig, self.images)
        animation.save(filename, writer='imagemagick', fps=1)
The rest of the code is mainly taken from How to compute the Mandelbrot Set using NumPy Array Operations.
Python Code
Here’s the complete Python program:
from __future__ import division

import numpy as np
import matplotlib.pyplot as plt
import matplotlib.animation as anim

class AnimatedGif:
    def __init__(self, size=(640, 480)):
        self.fig = plt.figure()
        self.fig.set_size_inches(size[0] / 100, size[1] / 100)
        ax = self.fig.add_axes([0, 0, 1, 1], frameon=False, aspect=1)
        ax.set_xticks([])
        ax.set_yticks([])
        self.images = []

    def add(self, image, label=''):
        plt_im = plt.imshow(image, cmap='Greys', vmin=0, vmax=1, animated=True)
        plt_txt = plt.text(10, 310, label, color='red')
        self.images.append([plt_im, plt_txt])

    def save(self, filename):
        animation = anim.ArtistAnimation(self.fig, self.images)
        animation.save(filename, writer='imagemagick', fps=1)

m = 480
n = 320
x = np.linspace(-2, 1, num=m).reshape((1, m))
y = np.linspace(-1, 1, num=n).reshape((n, 1))
C = np.tile(x, (n, 1)) + 1j * np.tile(y, (1, m))
Z = np.zeros((n, m), dtype=complex)
M = np.full((n, m), True, dtype=bool)

animated_gif = AnimatedGif(size=(m, n))
animated_gif.add(M, label='0')
images = []
for i in range(1, 151):
    Z[M] = Z[M] * Z[M] + C[M]
    M[np.abs(Z) > 2] = False
    if i <= 15 or not (i % 10):
        animated_gif.add(M, label=str(i))

animated_gif.save('mandelbrot-animated.gif')
Nice! Thanks for sharing.
Note: `from __future__ import division` is not necessary (for those using Python 2.7+ like myself).
Also the code may be grately simplified. Here's is my version:
import numpy as np
import matplotlib.pyplot as plt
from matplotlib import animation
# This is the only function (method) actually needed
def add_image(image, label=''):
plt_im = plt.imshow(image, cmap='Greys', vmin=0, vmax=1, animated=True)
plt_txt = plt.text(10, 310, label, color='red')
images.append([plt_im, plt_txt])
w,h = 480,320
x = np.linspace(-2, 1, num=w).reshape((1, w))
y = np.linspace(-1, 1, num=h).reshape((h, 1))
C = np.tile(x, (h, 1)) + 1j * np.tile(y, (1, w))
Z = np.zeros((h, w), dtype=complex)
M = np.full((h, w), True, dtype=bool)
fig = plt.figure()
fig.set_size_inches(w/100, h/100)
ax = fig.add_axes([0,0,1,1], frameon=False, aspect=1)
ax.set_xticks([]); ax.set_yticks([])
images = []
add_image(M, label='0')
for i in range(1, 151):
Z[M] = Z[M] * Z[M] + C[M]
M[np.abs(Z) > 2] = False
if i <= 15 or not (i % 10):
add_image(M, label=str(i))
plt.pause(0.1) # Add this if you want to see the animation live
print "* Done *" # Add this in live animation so that you know when it is finsihed (avoiding thus graphics interruption)
# Save the animation
anim = animation.ArtistAnimation(fig, images)
anim.save('z.gif', writer='imagemagick', fps=1) ; print "File 'z.gif' created"
The statement
from __future__ import divisionis not necessary for Python 3, it is necessary for Python 2. See One Code to Run Them All (Python 2 and Python 3) for some more details on this.Python is amazingly powerful: few code in - > lots of functionality out! I think you could generate amazing pictures when you would for example use Mandelbrot to generate 3d landscapes. Blender supports python 3 for scripting. I recently found an amazing step-by-step article about using python+blender as an art generator:
https://medium.com/@behreajj/creative-coding-in-blender-a-primer-53e79f…
Add new comment