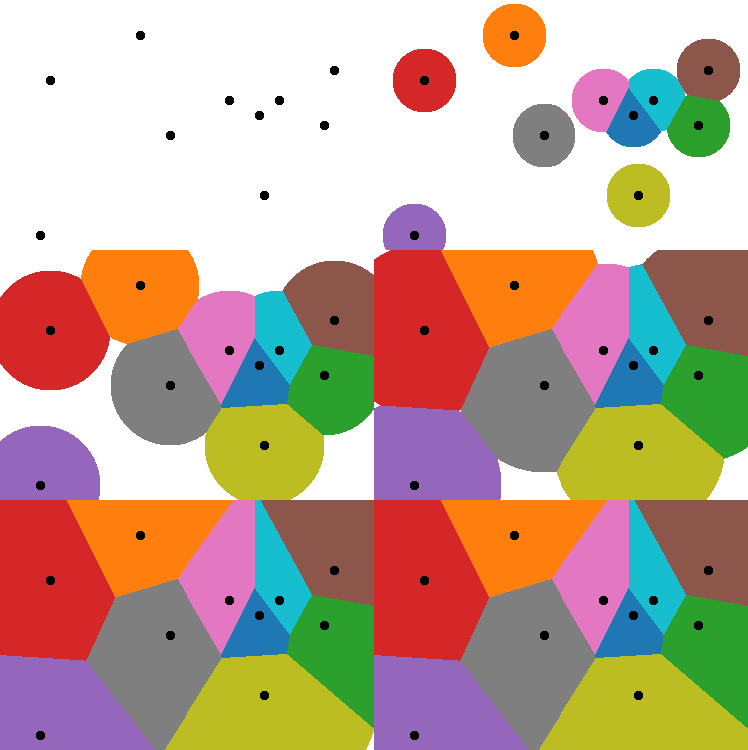
A Voronoi diagram is a partition of the plane into a number of cells, where each cell consists of exactly those points that are closest to the site (or seed point) of that cell. An example with ten seed points is shown in Figure 1.
 Figure 1. Voronoi diagram with ten seed points.
More formally, if the set of \(n\) sites is \(\{p_1, ..., p_n\}\), then the points of cell \(C_i\) are determined by
\[C_i=\{x\in\mathbb{R^2}\,|\,d(x,p_i)\leq d(x,p_j)\,\,\forall i\neq j\}\]
In this definition, \(d\) is the distance between two points. The definition can be generalized to higher dimensions and sites that are themselves sets of points instead of single points, but I won’t go into that here. With \(\leq\) in the definition, the points on the edges of the cells belong to two cells, making the Voronoi diagram not an exact partition of the plane (for a partition, each point of the plane needs to be in exactly one cell). Changing the \(\leq\) to \(\lt\) causes the edges to be not in any cell, which isn’t an improvement. Making the edges belong to two cells seems to be the more logical choice.
There are many applications of Voronoi diagrams, a particularly silly one being the following. If you have a huge lawn with several charging stations for your robotic lawn mower, then a Voronoi diagram with the charging stations as sites has cells that group all locations for which the nearest charging station is the site of that cell.
For bloggers, a very nice property of Voronoi diagrams is that you can create cool-looking animations by growing the Voronoi cells from each of the sites (Figure 2).
 Figure 2. Voronoi diagram growing from the seed points.
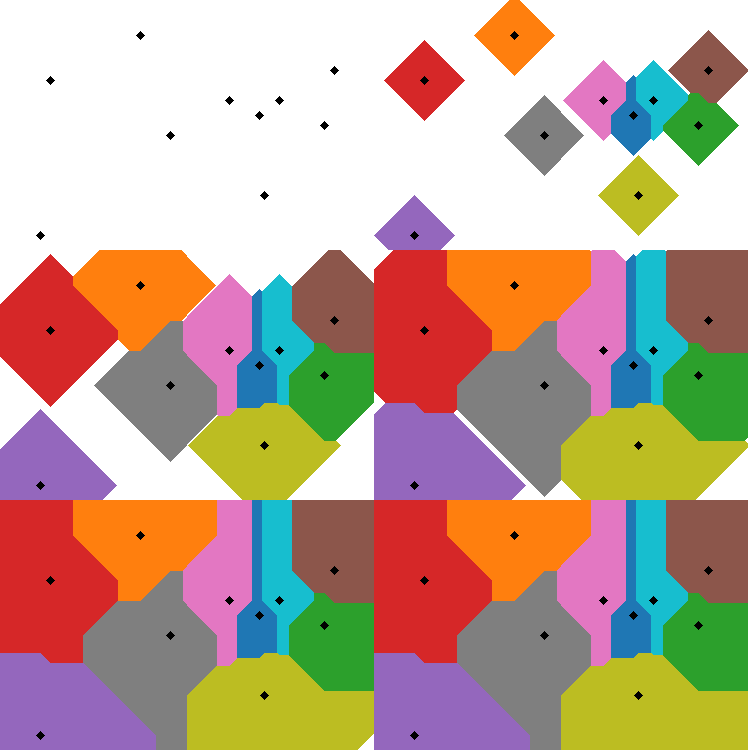
An interesting variant is to use a different definition for the distance function (see What's in a Distance for details). If you want to route, say, an order for a pizza to the nearest restaurant in New York City, then the aptly-called Manhattan distance might be a good choice. Figure 3 shows an example of a Voronoi diagram that uses this definition of distance.
 Figure 3. Voronoi diagram using the Manhattan distance.
Add new comment