 Skill Bubbles
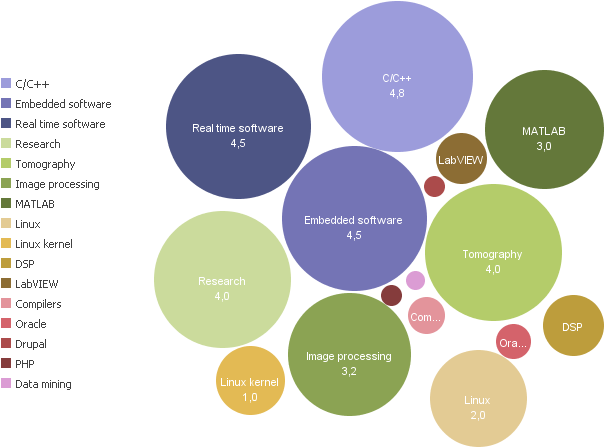
This colorful bubble chart is a simple way of freshening up your CV by adding the time dimension to your skill list. A simple list has relatively little value, since it doesn’t indicate the importance of each skill. This can be improved by including an estimate of its strength. To do this, you could simply add the number of years of experience, but I propose to go a bit further.
How can you estimate the strength of your skills more completely? What you could do is
- take the time that you have been working on it (in years),
- multiply that by the depth with which you were involved with it (as a percentage), and,
- if necessary, correct for the fact that you haven’t been using it for a while (using decay, see below).
I first give some practical examples, and then provide the nitty-gritty details.
In Practice
I’ve just picked some of my own skills as an example. The last 4 years, I have been doing research on computed tomography (CT or CAT). I did this full time, so I count 4 years at 100%. I’m still doing it now, so these skills are still fresh and there is no decay. The graph has 4.0 for the skills “Research” and “Tomography”.
For the skill “Image processing”, of which tomography is an example, I’ve used 80% for depth, since tomography is a rather specific application, and I’m a bit less of an expert in image processing in general. The graph has 3.2 for this skill, which is 4.0 x 80%.
A third example is “Embedded software”. I have 9 years of experience with different kinds of embedded software, but I’ve stopped working with it 4 years ago. If we assume that the strength of a skill halves after a certain number of years, we can use the classical half-life formula that is also used for radioactive elements. For this example, I assume that the strength of a skill halves in 4 years. If the initial strength is 4 and the half-life is also 4, then the strength is 2 after 4 years and 1 after 8. For an initial strength of 9, this works out to 4.5 after 4 years. The chart has 4.5 for the skill “Embedded software”.
Technical Details
The formula to compute the decay is
\[s_t=s_0\left(\frac{1}{2}\right)^{t/h},\]
where \(s_0\) is the initial strength of the experience (which is the total number of years times the depth), \(t\) is the time (in years) that the skill wasn’t practiced anymore, and \(h\) is the half-life. So with \(s_0=9\), \(t=4\), and \(h=4\), we get
\[s_t=9\left(\frac{1}{2}\right)^{4/4}=4.5.\]
In a spreadsheet, you can use “=A1*POWER(0.5, A2/A3)”, where A1 corresponds to \(s_0\), A2 to \(t\), and A3 to \(h\).
[update] As Phil Rankin remarks in the comments, Many Eyes is not available anymore.
[update 2] Phil Rankin has created an Excel sheet that implements a variation on these skill bubbles. He calls it Talent Stack, and has put it on GitHub. Have a look!
Skill-Bubbles.
I really love this article since I have been looking at doing this on my resume. Would it be ok for me to use these formulas to create an excel spreadsheet to create the bubble chart? "Many Eyes" no longer exists but excel supports bubble charts. I will send you what I end up creating and also credit you on the idea of the skill decay.
Thanks, Phil
Yes, feel free to use it! I would indeed be interested to see what you end up with.
Regards, Tom
Add new comment